Exercise 4a
Export the plots as a JPEG and then create a page describing what you did in either a ex4a.md or ex4a.html page linking to the images.
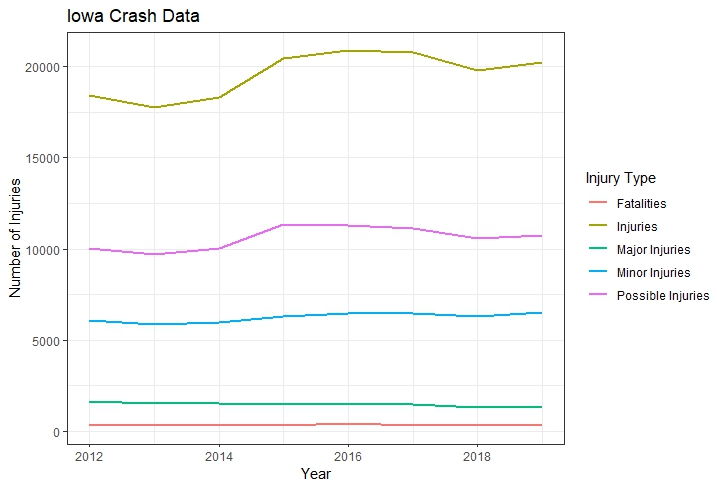
These plots are for Iowa Crashes that the data reference is “https://data.iowadot.gov/datasets/IowaDOT::crash-data-sor/about”
For the first plot I grouped the data by CRASH_YEAR and calculate the sum of each injury type.
For the second plot I created a histogram of fatalities, colored by CRASH_YEAR and split by DRUGALCREL.